Software Testing Report: Structure, Format & Real Examples
A software test report summarizes testing activities, results, defects, and risks to show overall product quality and release readiness. It turns raw test data into clear metrics and insights that help stakeholders make confident go/no-go decisions.
A software testing report tells the entire team whether the product is ready to ship, but most teams still cobble it together from three tools, a spreadsheet, and a Slack message five minutes before the release meeting.
The real pain is not in testing. It is in the gap between what QA knows and what stakeholders actually see. One vague pass/fail count or a missing defect summary is enough to stall a production release.
This guide breaks down how to write a software testing report that answers every question before it is asked. You will see the right structure, a proven format, and real examples that work in agile and CI/CD environments.
What is a software testing report?
Definition: A software testing report is a structured document that summarizes all testing activities, presents test execution results, highlights defects, and provides data-driven insights for release decisions.
Think of it as a single document that shows everyone where the product stands in terms of quality. It captures what was tested, what passed, what failed, and what risks remain before going live.
A well-written software testing report replaces guesswork with measurable data. Instead of "we tested the login module," it says "142 test cases executed, 138 passed, 3 failed with critical severity, 1 blocked due to API dependency."
The format traces back to standards defined by IEEE 829 (now part of ISO/IEC/IEEE 29119-3). Most modern teams adapt these templates to fit their workflow, but the core sections remain:
-
Executive summary with a go/no-go recommendation
-
Test scope and objectives
-
Test execution metrics (pass, fail, blocked, skipped)
-
Defect analysis with severity and priority breakdown
-
Risk assessment and open issues
-
Environment and configuration details
Teams using test automation frameworks generate parts of this report automatically after every CI/CD run. The manual effort shifts from data collection to analysis and recommendations.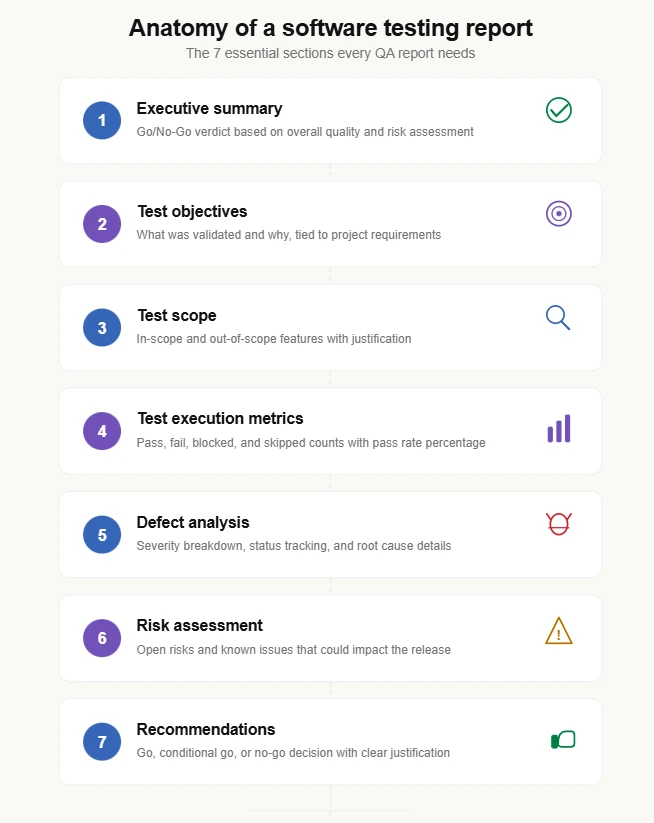
Why does your team need a software testing report?
A software testing report is not just paperwork. It is the bridge between engineering work and business decisions.
Without a structured report, stakeholders rely on verbal updates or chat messages. These are easy to misinterpret and impossible to audit later. A formal software test report creates a documented trail everyone can reference.
Here is what a proper software testing report delivers:
-
Clear release readiness: Stakeholders see pass/fail rates, open critical defects, and risk levels in one place
-
Faster defect resolution: Developers get severity-tagged bugs with reproduction steps instead of vague descriptions
-
Historical comparison: Teams compare test quality metrics across sprints to spot regressions early
-
Compliance support: Industries like healthcare, finance, and automotive require documented test evidence for audits
-
Team alignment: QA, dev, and product teams share the same quality picture instead of working with different assumptions

Tip: Start generating your software testing report at the end of every sprint, not just before a major release. Sprint-level reports catch quality trends early and prevent last-minute surprises.
According to the World Quality Report 2023-24 by Capgemini, 60% of organizations struggle with inadequate QA reporting practices that delay release decisions. A structured report puts the right data in front of the right people at the right time.
One pattern that works well: use a tool like TestDino to auto-generate the metrics after each CI run, then have the QA lead add a 3-sentence executive summary and risk assessment on top. This keeps reporting under 15 minutes per sprint.
Different types of test reports
Not every software testing report serves the same purpose. The type of report depends on the testing phase, the audience, and the level of detail required.
Understanding these types helps QA teams communicate the right information to the right stakeholders.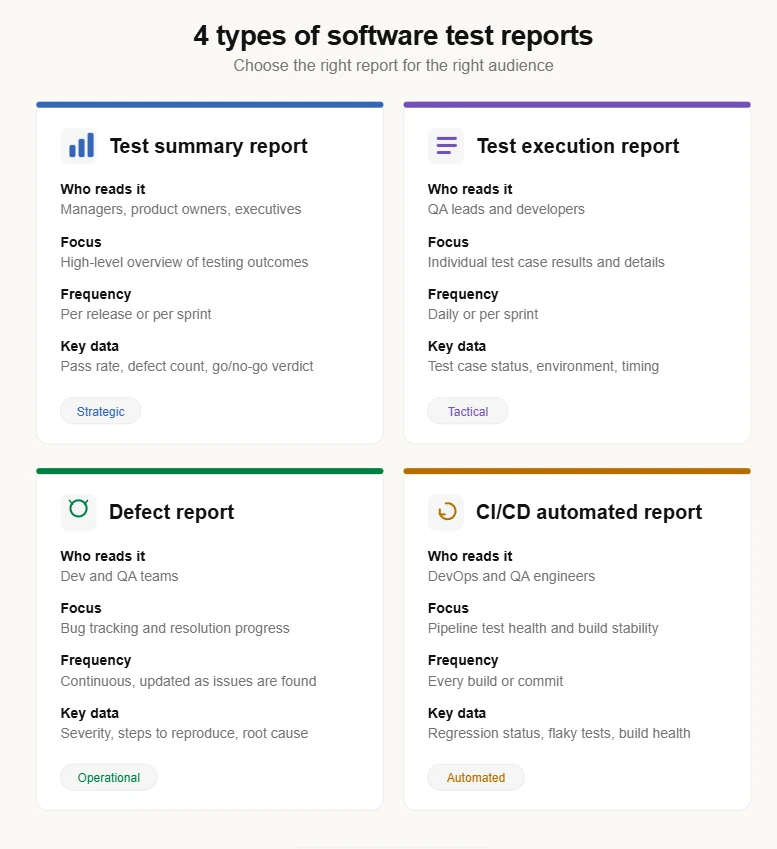
1. Test summary report
A test summary report provides a high-level overview of all testing activities during a sprint, release, or project phase.
It is the most common type of software testing report shared with project managers, product owners, and executives. The focus is on aggregated metrics, not individual test case details.
The screenshot below shows how TestDino presents a test run summary with pass/fail/flaky breakdowns, timing data, and environment context, all generated automatically from CI pipeline outputs.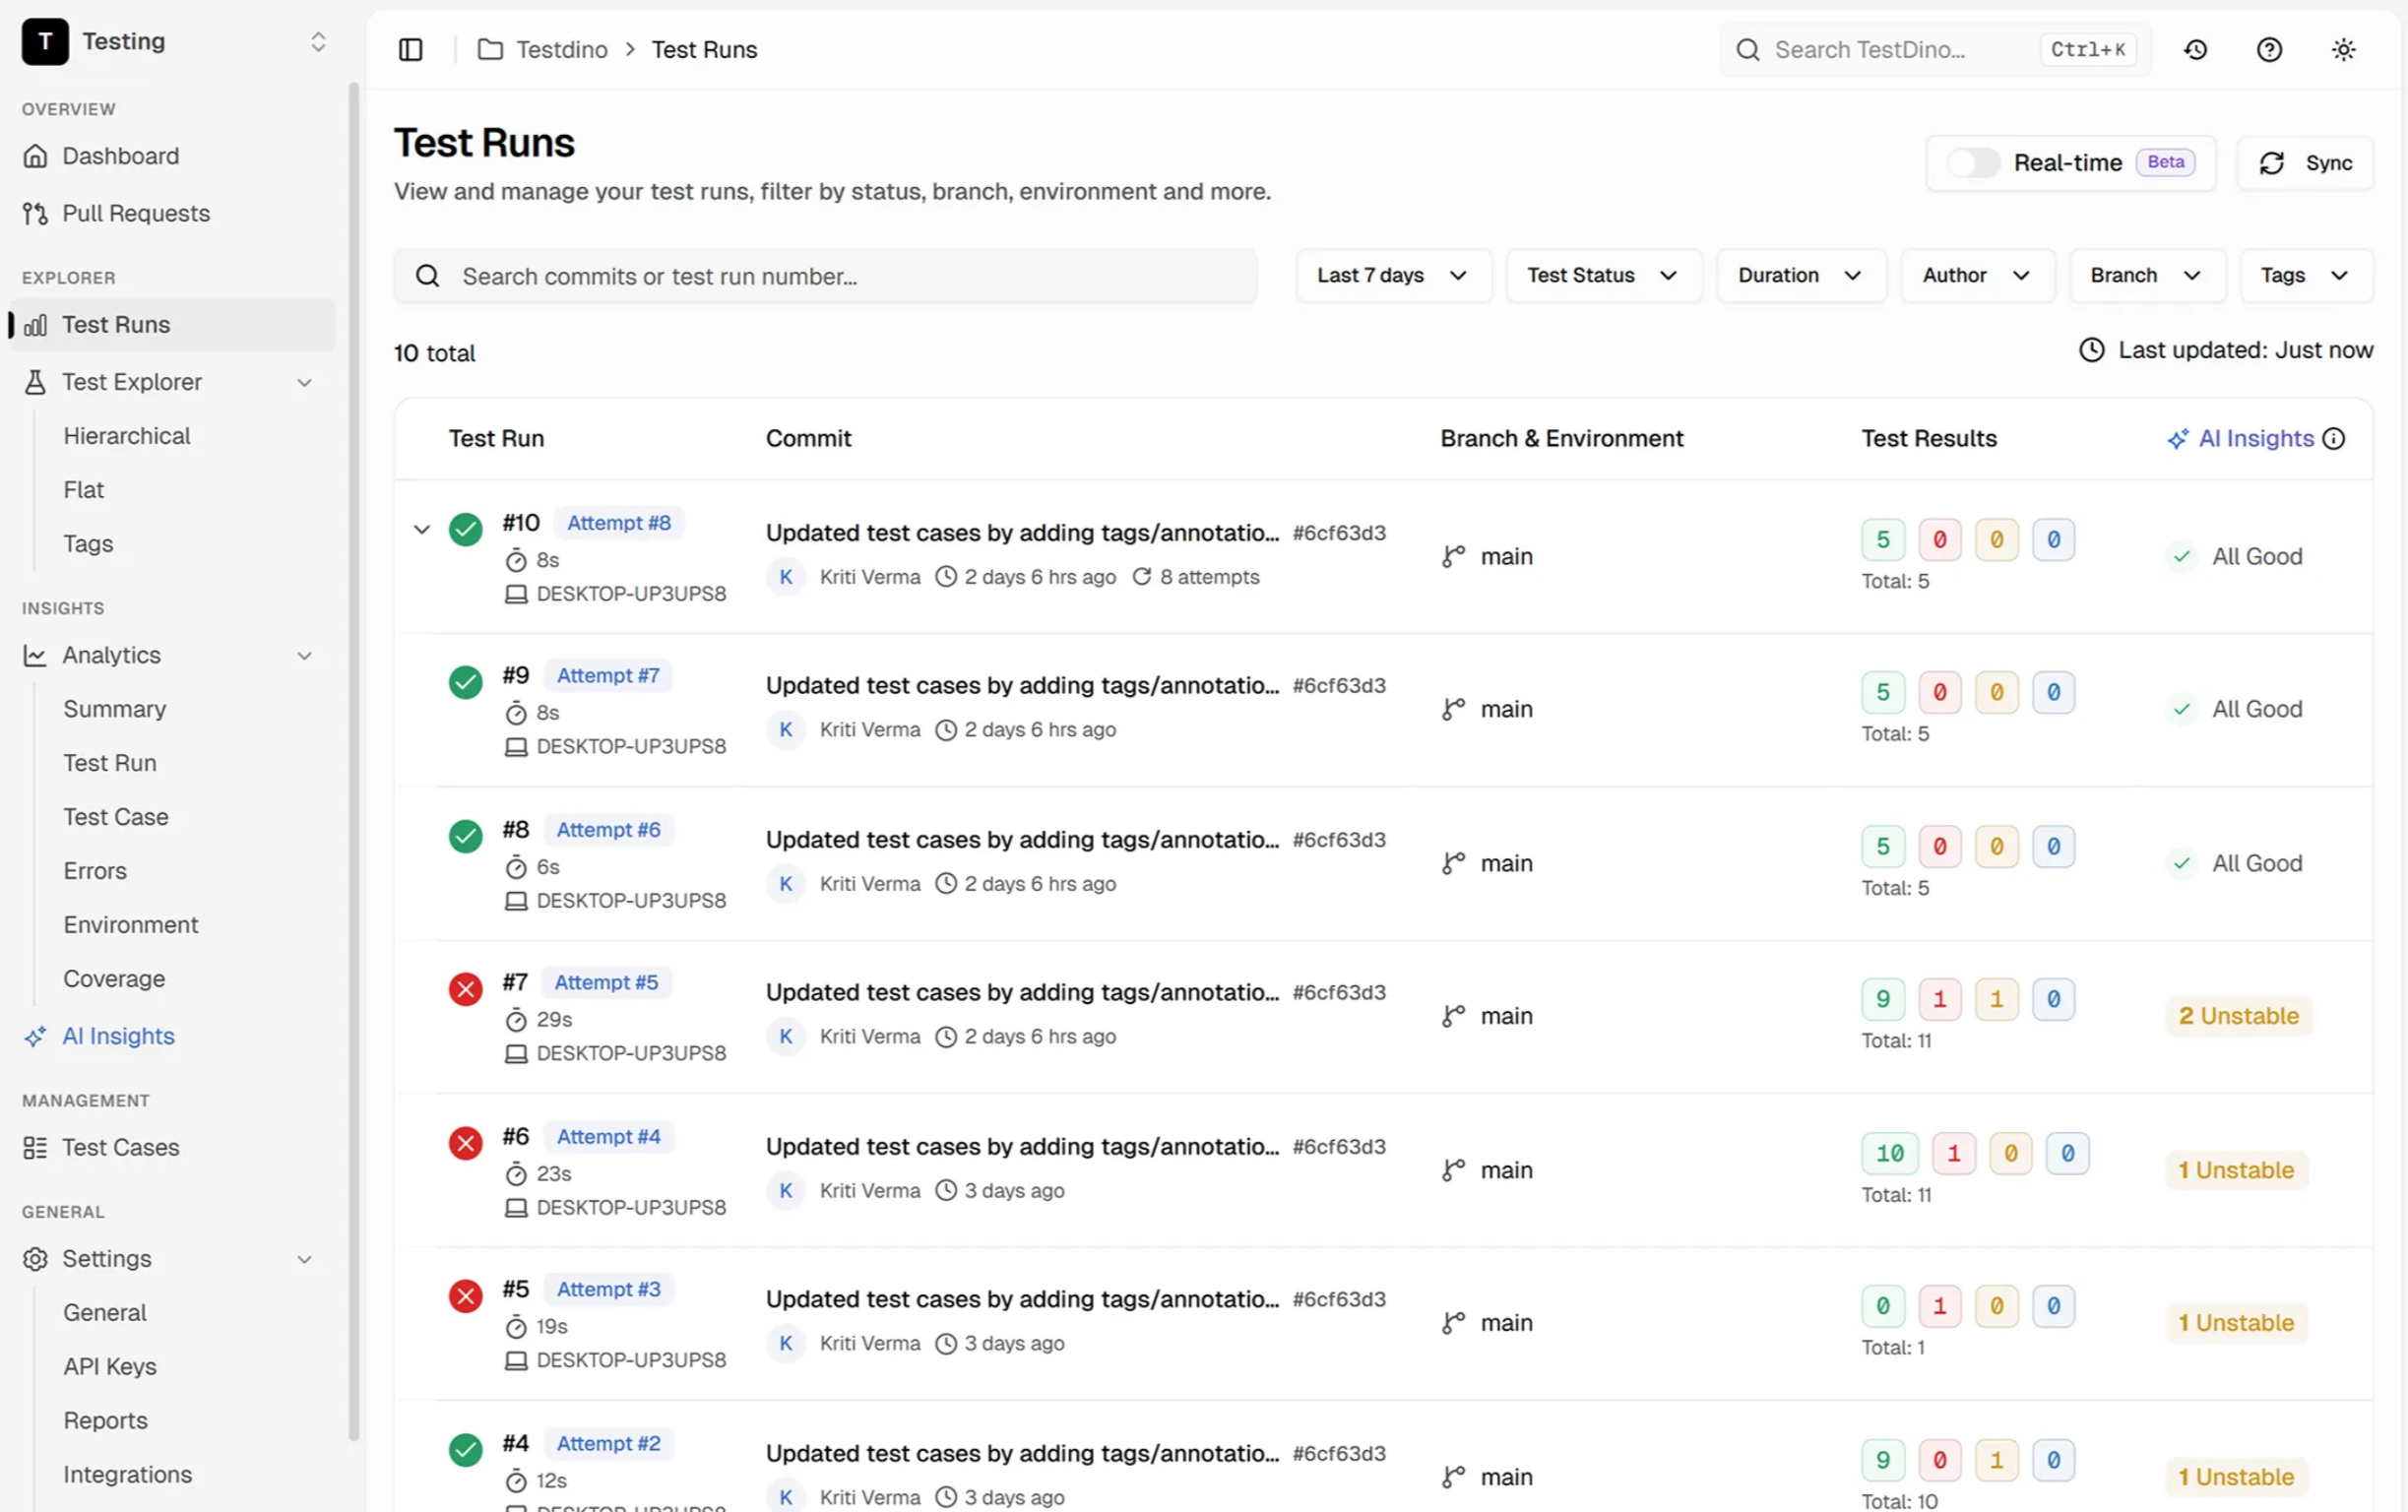
A typical test summary report includes:
-
Total test cases planned vs. executed
-
Pass/fail/blocked/skipped breakdown
-
Defect count by severity (critical, major, minor)
-
Test coverage percentage
-
Go/no-go release recommendation
This report answers one question: "Is the product ready to ship?"
Teams using Playwright test reporting tools can auto-generate summary data directly from CI pipeline outputs. Platforms like TestDino pull results from every run, track trends, and flag regressions without manual data entry.
2. Test execution report
A test execution report goes deeper. It captures the results of individual test case runs during a specific cycle, such as a regression run or a smoke test.
Each entry in a test execution report includes:
-
Test case ID and description
-
Execution date and environment
-
Status (pass, fail, blocked, skipped)
-
Tester name or automation tool reference
-
Comments or failure details
Here is how test cases look inside TestDino's test case management interface. Each case tracks its execution history, linked defects, and pass/fail status across multiple runs.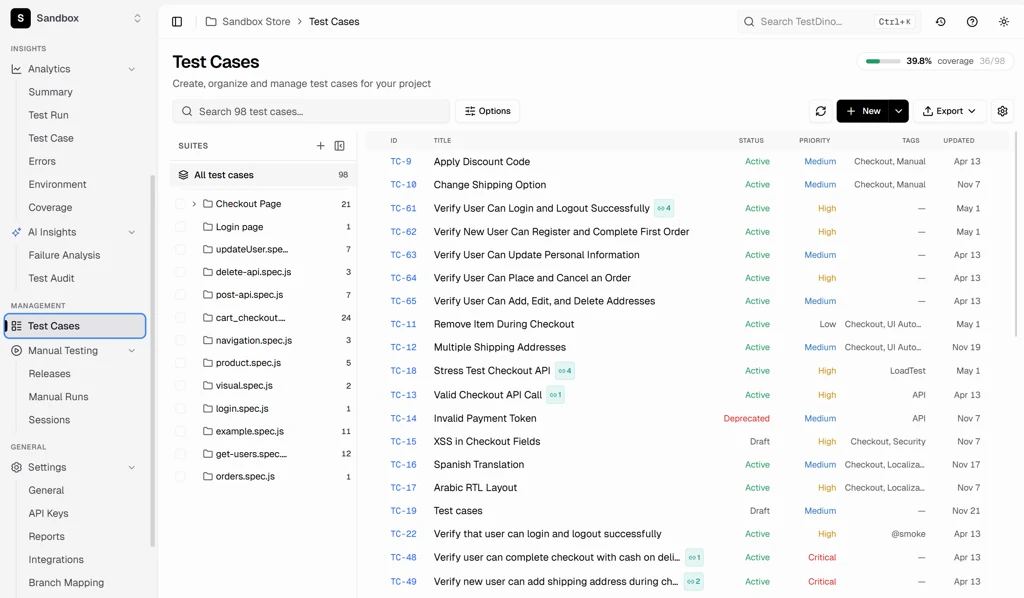
Here is an example of what a test execution report table looks like:
| Test Case ID | Module | Status | Severity | Comments |
|---|---|---|---|---|
| TC-101 | Login | Pass | N/A | Successful login with valid credentials |
| TC-102 | Payment | Fail | Critical | Payment gateway timeout after 30 seconds |
| TC-103 | Cart | Blocked | Major | API dependency unavailable in staging |
| TC-104 | Search | Pass | N/A | Results returned within 2 seconds |
| TC-105 | Profile | Skipped | Minor | Feature not deployed to test environment |
This report helps QA leads identify unstable modules and plan retesting. In agile teams, it is typically generated daily or per sprint.
Note: Test execution reports generated from automation frameworks like Playwright include timestamps, browser versions, and trace links automatically, which reduces manual documentation effort.
3. Defect report
A defect report (or bug report) focuses specifically on issues found during testing. It is a subset of the overall software testing report but critical for tracking resolution progress.
Each defect entry should include:
-
Defect ID and title
-
Module or feature affected
-
Steps to reproduce
-
Expected vs. actual behavior
-
Severity and priority
-
Current status (open, in progress, fixed, closed)
-
Root cause (if identified)
Here is an example:
| Field | Details |
|---|---|
| Defect ID | BUG-245 |
| Module | Checkout |
| Severity | Critical |
| Priority | High |
| Status | Open |
| Steps to Reproduce | Add item to cart > Proceed to checkout > Click "Pay Now" |
| Expected Result | Payment confirmation page loads |
| Actual Result | 504 Gateway Timeout after 30 seconds |
| Root Cause | Incorrect API response handling in payment service |
Advanced defect reports also include defect density metrics and trend charts. Teams can track these over time using test analytics dashboards. TestDino's analytics views visualize defect density and failure hotspots across sprints, making it easier to catch patterns before they compound.
4. CI/CD automated test report
A CI/CD automated test report is generated automatically after each build in a continuous integration pipeline.
This type of report provides real-time feedback on:
-
Regression test pass/fail status
-
Flaky test occurrences
-
Build stability metrics
-
Execution time per test suite
These reports are typically generated using frameworks like Playwright, Selenium, or Cypress, integrated with CI tools such as GitHub Actions, Jenkins, or GitLab CI.
Here is an example of generating and viewing a Playwright test report:
npx playwright test
npx playwright show-report
You can configure different reporters (HTML, JSON, JUnit, or custom) for specific reporting needs:
// playwright.config.ts
import { defineConfig } from '@playwright/test';
export default defineConfig({
  reporter: [
    ['html', { outputFolder: 'playwright-report' }],
    ['json', { outputFile: 'results.json' }],
    ['junit', { outputFile: 'results.xml' }]
  ],
});
For teams running tests in GitHub Actions, automated reports become part of every pull request workflow. TestDino takes this further by posting test results directly as PR comments with pass/fail diffs against the base branch, so developers get immediate feedback before merging.
What to include in a software testing report
A strong software test report format follows a predictable structure. Every reader should know exactly where to find the information they need.
Here are the essential sections of a professional software testing report:
Project information
-
Project name and version
-
Testing phase (sprint number, release candidate)
-
Report date and prepared by
-
Distribution list (who receives this report)
Test objectives
Define what the testing aimed to verify. Be specific.
For example, instead of "Test the checkout flow," write "Verify that checkout completes successfully for credit card, PayPal, and Apple Pay across Chrome, Firefox, and Safari."
Test scope
Clearly state what was tested and what was not. This prevents assumptions.
-
In scope: Login, registration, checkout, search, user profile
-
Out of scope: Admin panel, third-party payment reconciliation, mobile native app
Test environment details
Document the exact environment used for testing:
-
Browser versions (Chrome 125, Firefox 126, Safari 17.4)
-
Operating systems (Windows 11, macOS Sonoma, Ubuntu 22.04)
-
Server/API endpoints (staging-api.example.com)
-
Database versions and test data sets
Test execution summary
This is the core of any software testing report. Present the numbers clearly:
| Metric | Count |
|---|---|
| Total Test Cases | 487 |
| Passed | 461 |
| Failed | 18 |
| Blocked | 5 |
| Skipped | 3 |
| Pass Rate | 94.7% |
| Defects Found | 22 |
| Critical Defects | 4 |
Defect summary
Group defects by severity and module. This helps developers prioritize fixes.
| Severity | Count | Status |
|---|---|---|
| Critical | 4 | 2 Open, 2 Fixed |
| Major | 8 | 3 Open, 5 Fixed |
| Minor | 7 | 1 Open, 6 Fixed |
| Cosmetic | 3 | All Fixed |
Risk assessment
List open risks that could impact the release:
-
Two critical defects in the payment module remain open
-
Cart performance degrades above 500 concurrent users
-
Third-party SMS API has intermittent failures in staging
Recommendations
End with a clear recommendation:
-
Go: All critical defects resolved, risk is acceptable
-
Conditional Go: Release with known limitations documented
-
No-Go: Critical issues remain unresolved
Tip: Keep the executive summary under 5 sentences. Busy stakeholders often read only this section before making a decision.
Step-by-step process to create a software testing report
Creating a software testing report does not have to be complicated. Follow these five steps to build one that is accurate, clear, and useful.
Step 1: Define the reporting goals
Before writing anything, answer these questions:
-
Who will read this report? (Managers, developers, QA team, compliance)
-
What decision does this report support? (Sprint review, release approval, audit)
-
How detailed should it be? (Executive summary vs. full technical report)
The answers shape everything from the format to the level of detail included. A report for a sprint review looks different from a pre-release sign-off document.
Step 2: Gather and validate test data
Collect test results from all sources:
-
Test management tools for manual test case results
-
CI/CD pipelines for automated test outputs
-
Bug tracking systems (Jira, Linear, Asana) for defect data
-
Environment logs for configuration details
Validate the numbers before including them. Cross-check pass/fail counts between your test runner and your test management tool. In TestDino, this happens automatically since results flow directly from the CI pipeline into the dashboard without manual re-entry.
For automated tests, use structured output formats:
npx playwright test --reporter=jsonThis produces machine-readable results that can be imported into reporting dashboards or fed directly into TestDino's custom reporter.
Step 3: Analyze metrics and trends
Do not just report numbers. Interpret them.
-
Is the pass rate improving or declining compared to the last sprint?
-
Are failures concentrated in a specific module?
-
Are there flaky tests inflating the failure count?
-
How does the current defect density compare to previous releases?
Trend analysis turns a static report into an actionable document. Teams tracking reporting metrics over time can predict quality issues before they become blockers. TestDino's historical run insights make this comparison visual by overlaying results across branches, environments, and releases.
Step 4: Present results clearly
Use tables for metrics. Use bullet points for lists. Avoid long paragraphs in the data sections.
A few formatting guidelines:
-
Summary tables for pass/fail counts and defect breakdowns
-
Charts for defect severity distribution (if your tool supports it)
-
Color coding for status (green = pass, red = fail, yellow = blocked)
-
Short descriptions for failed test cases with links to defect tickets
Step 5: Add final recommendations
End the report with a clear call:
-
State whether the release is recommended, conditionally recommended, or not recommended
-
List the conditions (if conditional), such as "fix BUG-245 and BUG-312 before production deployment"
-
Include a QA sign-off statement with name and date
This step transforms the software testing report from documentation into a decision-making tool.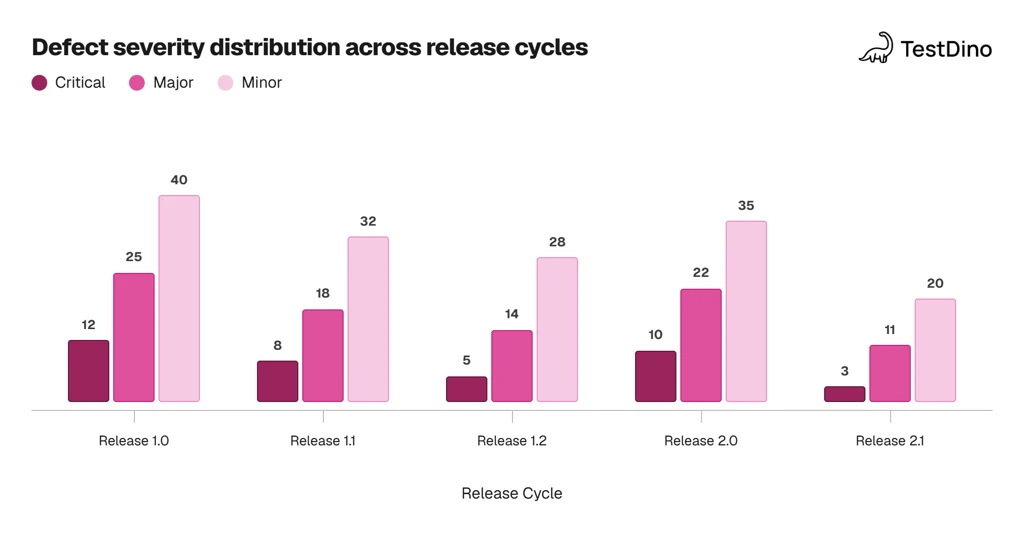
Source: Aggregated from the World Quality Report 2023-24 by Capgemini showing industry average defect distribution trends across release cycles
Tools for generating software test reports
Modern QA teams use specialized tools to generate accurate software testing reports. Manual reporting is error-prone and time-consuming. These tools automate data collection, formatting, and visualization.
1. TestDino
TestDino is a Playwright-focused reporting and test visibility platform built for teams running tests in CI pipelines. It supports two reporting approaches:
-
Native JSON/HTML upload: Simple post-run reporting with minimal setup
-
TestDino custom reporter: Richer metadata, real-time updates, and CI controls for larger teams
Key capabilities include:
-
Flaky test detection that identifies unstable tests over time
-
Cross-environment insights for staging, QA, and production
-
AI-powered failure analysis that explains why tests failed
-
Historical run insights for comparing results across branches and releases
-
Evidence-rich failure views with screenshots, videos, traces, and logs
-
Role-based dashboards tailored for QA, developers, and managers
-
PR workflow automation with automatic PR comments and commit status updates
-
Manual and automated test case management in one place
-
Integrations with Slack, Jira, Linear, GitHub, and CI tools
TestDino works well when a team has 50+ automated tests, runs CI on every commit, or has multiple developers sharing responsibility for test failures.
| Plan | Price |
|---|---|
| Starter | Free |
| Pro | $49/month |
| Team | $99/month |
| Enterprise | Custom pricing |
For teams using AI-assisted test generation, the Playwright skill by TestDino can generate and maintain Playwright tests automatically, feeding results directly into the reporting dashboard.
2. Allure Report
Allure Report is an open-source framework that converts raw test results into interactive HTML-based reports. It works with Playwright, Selenium, Cypress, JUnit, TestNG, and other frameworks.
Key features:
-
Framework-agnostic integration without changing test code
-
Interactive dashboards with pass/fail rates and execution duration
-
Execution timeline for analyzing parallel test behavior
-
Historical trend tracking for stability analysis
-
Rich attachments (screenshots, logs, videos, API responses)
-
BDD and feature-level grouping for Gherkin-based scenarios
-
CI/CD compatibility with Jenkins, GitHub Actions, and GitLab CI
3. ReportPortal
ReportPortal is an AI-driven centralized reporting platform for large-scale automation environments.
Key features:
-
AI-based flaky test detection using machine learning
-
Real-time execution dashboards during pipeline runs
-
Failure clustering and root cause analysis
-
Multi-project aggregation across frameworks and repositories
-
Advanced quality KPIs (defect density, failure rate trends)
-
REST API integration for CI/CD systems
4. ExtentReports
ExtentReports is a customizable reporting library for Selenium, Playwright, and other frameworks that generates HTML-based reports.
Key features:
-
Fully customizable HTML themes for branded reports
-
Hierarchical test structure (suite > case > step)
-
Step-level logging with INFO, PASS, FAIL, WARNING, and DEBUG levels
-
Embedded screenshots for failed test cases
-
Parallel execution support with proper result aggregation
-
BDD integration for Gherkin-based scenarios
5. Zebrunner
Zebrunner is a test reporting and quality observability platform for centralizing automation results.
Key features:
-
Cross-framework support (Playwright, Selenium, Cypress, Appium)
-
Real-time execution monitoring during test runs
-
AI-assisted failure pattern detection
-
Comprehensive artifact capture (screenshots, videos, logs, traces)
-
Regression impact analytics comparing builds
-
CI/CD integration with Jenkins, GitHub Actions, and GitLab CI
6. Calliope.pro
Calliope.pro is a test reporting and quality intelligence platform focused on visual analytics and collaboration.
Key features:
-
Interactive drill-down dashboards for deep metric inspection
-
Cross-project aggregation across teams and repositories
-
Collaboration features with tagging and annotation on failures
-
Trend visualization for pass rates and defect density
-
Exportable reports in HTML, JSON, and shareable formats
-
Advanced filtering by module, severity, tag, or environment
For a deeper comparison of test reporting solutions, explore the full test reporting tools breakdown.
Best practices for clear and actionable test reports
A software testing report is only useful if people actually read and act on it. These practices help make that happen.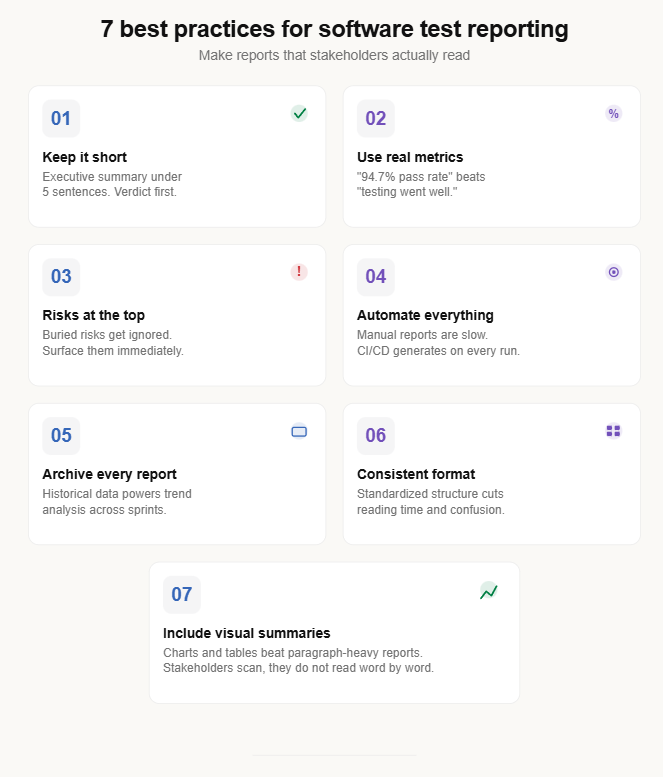
| Best Practice | Why It Matters |
|---|---|
| Keep the executive summary under 5 sentences | Decision-makers skim. Give them the verdict first. |
| Use metrics, not opinions | "94.7% pass rate with 4 critical defects open" beats "testing went mostly well." |
| Highlight critical risks at the top | Buried risks get ignored. Surface them immediately. |
| Automate report generation | Manual reports are slow and error-prone. CI/CD pipelines generate reports on every run. |
| Archive every report | Historical data enables trend analysis and sprint-over-sprint comparison. |
| Follow a consistent format | A standardized software test report format reduces reading time and prevents confusion. |
| Include visual summaries | Charts and tables improve comprehension compared to paragraph-heavy reports. |
Beyond these basics, consider these additional practices:
Tailor the depth to the audience. Developers want stack traces and reproduction steps. Managers want pass rates and risk summaries. Tools like TestDino solve this with role-based dashboards that show different views for QA, dev, and management.
Link defects to test cases. Every failed test should reference a bug ticket. This creates traceability from test execution to defect resolution.
Include environment details always. A test that passes in staging and fails in production is useless without environment context.
Teams that invest in test automation reporting practices see measurable improvements in release confidence and defect resolution speed.
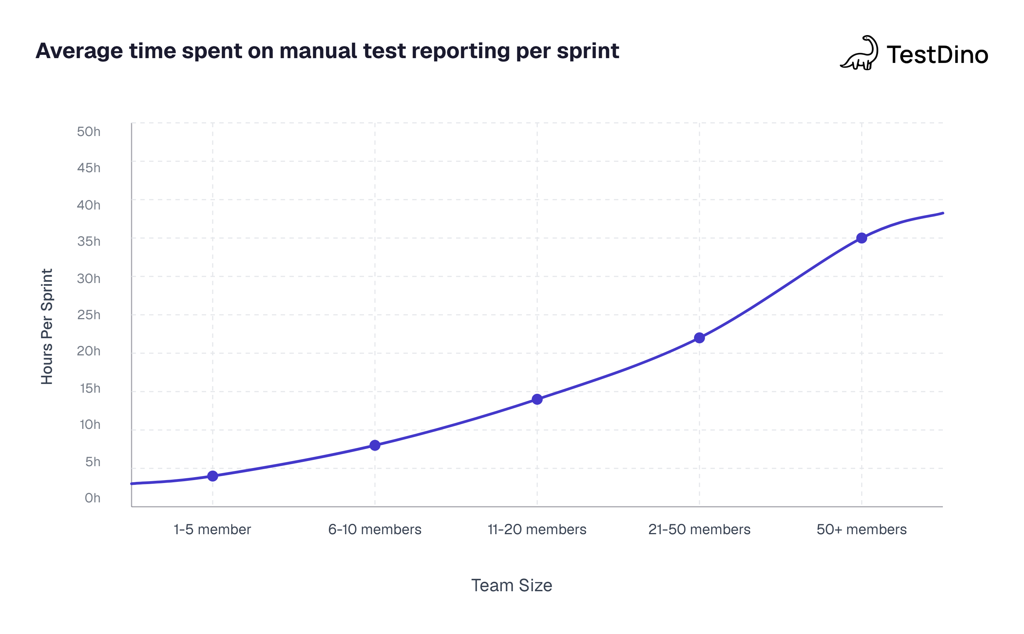
Source: World Quality Report 2023-24 by Capgemini, showing average manual reporting effort by team size before automation adoption
Common mistakes in software test reporting
Even experienced QA teams make reporting mistakes that reduce the value of their software testing report. Here are the most common ones and how to avoid them.
Inconsistent severity classification
Different team members classify the same issue as "critical," "major," or "minor" based on personal judgment. This skews the defect summary and misleads stakeholders about actual risk.
Fix: Define severity criteria upfront with examples.
-
Critical: System crash, data loss, security breach
-
Major: Feature not working, workflow blocked
-
Minor: UI alignment issues, incorrect label text
-
Cosmetic: Font inconsistency, color variation
Incomplete test coverage tracking
The report shows 95% pass rate, but only 60% of requirements were covered by test cases. This creates a false sense of quality.
Fix: Include a test coverage matrix that maps test cases to requirements. Track types of software testing coverage across functional, regression, and integration layers.
Manual report generation
Manually copying data from test tools into spreadsheets introduces errors and delays. By the time the report is ready, the data is already outdated.
Fix: Use CI reports that generate automatically after every pipeline run. TestDino generates these reports as part of the CI workflow, so the data is always current without any copy-paste steps.
No trend analysis
A single-sprint report shows what happened now. Without historical comparison, teams cannot tell if quality is improving or declining.
Fix: Maintain a historical archive of software testing reports. Compare key metrics (pass rate, defect density, flaky test count) across sprints to identify patterns. TestDino's test reporting features include built-in trend views that overlay metrics across multiple runs.
Delayed reporting
Reports delivered days after testing ends lose their value. Stakeholders need timely data to make release decisions.
Fix: Automate report generation to happen immediately after test execution completes. Teams following software testing trends and modern CI pipelines can deliver reports within minutes of a test run finishing.
Note: The IEEE 829 standard (now part of ISO/IEC/IEEE 29119-3) originally defined the template for test summary reports. Most teams have adapted it to agile workflows, but the core sections remain relevant and widely used.
Conclusion
A software testing report is not just a document you file away after every sprint. It is the tool that connects your testing effort to the decisions that matter.
The structure matters. A clear executive summary, accurate metrics, detailed defect analysis, and honest risk assessment give stakeholders everything they need to make confident release calls.
Start simple. Use the format and examples from this guide to build your first report. Then automate what you can. CI/CD pipelines, frameworks like Playwright, and platforms like TestDino can generate most of the data automatically, so your team spends time on analysis instead of data entry.
The goal is not to create a perfect document. It is to create a useful one that your team actually reads and acts on.
FAQs

Jashn Jain
Developer Advocate